How To Interpret a Restaurant Chart of Accounts for Valuable Insights

Any restaurant owner or investor should be familiar with the chart of accounts. At first glance, it might seem like simply an index of the financial accounts, but it can also:
- Provide valuable insights into income, expenses, assets, liabilities and equity
- Provide a standardized system to facilitate accurate bookkeeping
- Help management monitor performance and make informed financial decisions
But to get these valuable insights, you need to know how to read a restaurant chart of accounts and interpret what it’s telling you. So, let’s take a deep dive into the power of the chart of accounts and techniques for translating its data into actionable results in the restaurant industry.
Basic Elements of a Restaurant Chart of Accounts
The first step in getting more value from your restaurant’s chart of accounts is understanding its basic elements.
Your chart of accounts might vary slightly depending on the accounting software you use, but most include the following:
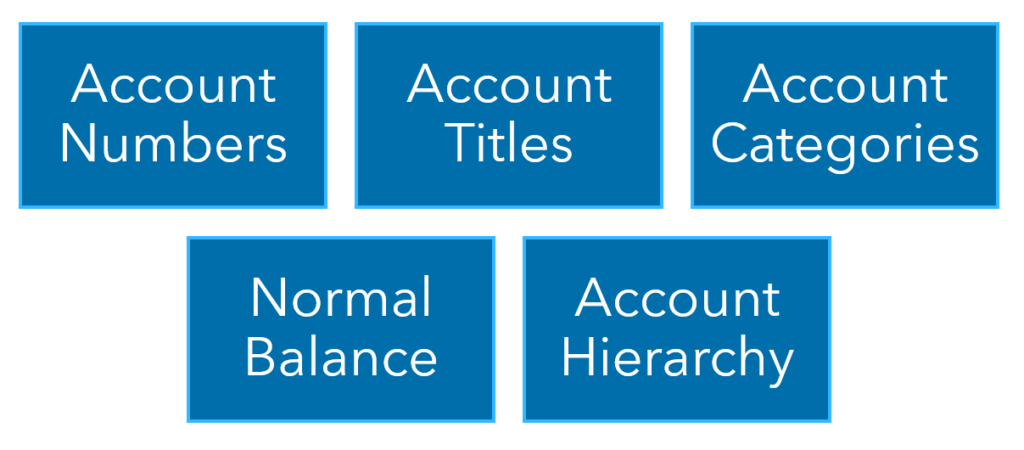
- Account numbers – Most charts of accounts have account numbers assigned to each account. While you can use any numbering system, many companies assign major categories to begin with a certain number. (For example, if asset accounts start with one and liabilities begin with two, cash might be 1001, and accounts payable might be 2001.)
- Account titles – A chart of accounts should include clear, descriptive titles, so users can quickly identify and differentiate between accounts.
- Account categories/subcategories – Besides the major account categories (assets, liabilities, equity, revenue, expenses), some restaurants have subcategories in their charts of accounts. (For example, you might break out current liabilities from long-term liabilities.)
- Normal balance – This is the side of an account where an increase in that account is recorded. (For example, increases are recorded as debits for asset accounts, so you would expect a cash account to have a debit balance.)
- Account hierarchy – A chart of accounts hierarchy breaks down accounts into specific divisions, departments or locations. This helps owners or managers quickly identify the source of income or expenses.
Things To Look for in a Restaurant Chart of Accounts
Now that you’ve familiarized yourself with the basic elements of a restaurant chart of accounts, it’s time to analyze it so you can actually glean insights from it. Here are some specific areas to consider for valuable insights.
Revenue and Expense Relationships
By analyzing the relationship between revenue and expense accounts in a restaurant’s chart of accounts, owners and investors can assess profitability to ensure the restaurant brings in enough revenue to cover expenses and provide a return on investment.
For example, you may be able to identify areas to reduce expenses and increase profits by examining individual line items, such as sales, food costs, labor, advertising and other overhead costs.

Asset and Liability Relationships
Analyzing the relationship between assets and liabilities helps determine the restaurant’s financial health and liquidity. By assessing the balance between asset and liability accounts, restaurant owners can identify potential issues that could impact cash flow or put the restaurant in a difficult financial position.
Equity Relationships
Equity represents the value that belongs to the organization’s owners. It’s affected by net income, dividends or distributions and additional investments.
Reviewing the equity section of your restaurant chart of accounts can help you determine whether owners have contributed enough capital and whether the return on investment they’re taking from the restaurant inhibits its ability to cover daily expenses and fund future growth plans.

Impact of Transactions
Analyzing the relationships between various accounts helps financial managers and restaurant owners understand how certain transactions will impact the financial statements of a business and identify whether they will contribute to increased profitability and cash flow.
For example, a sale (recorded in the restaurant’s revenue account) will also impact cash or accounts receivable, cost of goods sold and inventory. By understanding these relationships in your restaurant chart of accounts, owners can make informed decisions about spending, collections, purchasing and more.
Financial Ratios and Analysis
Analyzing the balances of different accounts allows restaurant owners, managers and investors to calculate various financial ratios and better understand the business’s financial health.
Financial ratios provide insights into the organization’s financial performance, profitability, liquidity and solvency. For example, you can calculate the current ratio to measure the restaurant’s ability to pay your short-term debts. Additionally, you can calculate the debt-to-equity ratio to assess the business’s risk levels.
Trend Analysis
Analyzing the relationships between different accounts over time helps to identify trends in financial performance. By looking at changes in a restaurant’s net income, expenses, cash balances and liabilities from month to month and year to year, you can see which areas are performing well or poorly and where you might need more resources.
Learn More About Your Restaurant Chart of Accounts and Financial Health for Your Business
If analyzed correctly by management and investors, a restaurant chart of accounts is much more than a list of accounts—it’s an invaluable asset to your restaurant operations that can help uncover inefficiencies and opportunities.
For more information about financial analysis for your restaurant or brewery, contact your Warren Averett advisor or ask a member of our team to reach out to you.